Olist Store Analysis | Power BI Project
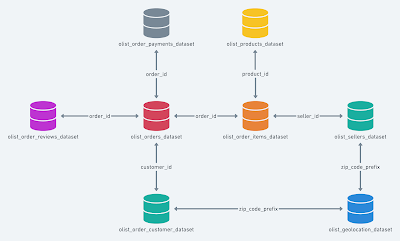
The OLIST STORE is an e-commerce business headquartered in Sao Paulo, Brazil. This firm acts as a single point of contact between various small businesses and the customers who wish to buy their products. In this project We are given multiple tables in CSV format and a schema depicting how these tables are connected. After connecting all the 8 tables, we analyze the entire dataset. It contains multiple categorical and numerical columns and information about 100k orders made at multiple marketplaces between 2016 to 2018.
In this project we are provided with 5 KPI’s on which we have to work & provide answers & solutions by analyzing the dataset. During this project we worked in different phases & tools. Steps involved in this process were data cleaning using power query, data modeling for fact & dimensions table based on the basis of primary & foreign key relationship present in the reference image provided. By using MYSQL Workbench we found the answers for particular KPI by joining the tables using joins concept. Finally to present the in depth analysis for each KPI in the form of an interactive dashboard we used Power BI.
Dataset:
Problem Statements(KPI):- Weekday Vs Weekend Payment Statistics
- Number of Orders with review score 5 and payment type as credit card
- Average number of days taken for Pet Shop
- Average price and payment values from customers of Sao Paulo city
- Relationship between shipping days Vs review scores
After importing the files in Pier BI I did the analysis on the above given KPI and tried to represent analysis & answers in the form of a dashboard using Power BI.
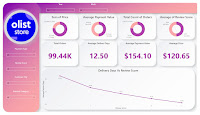
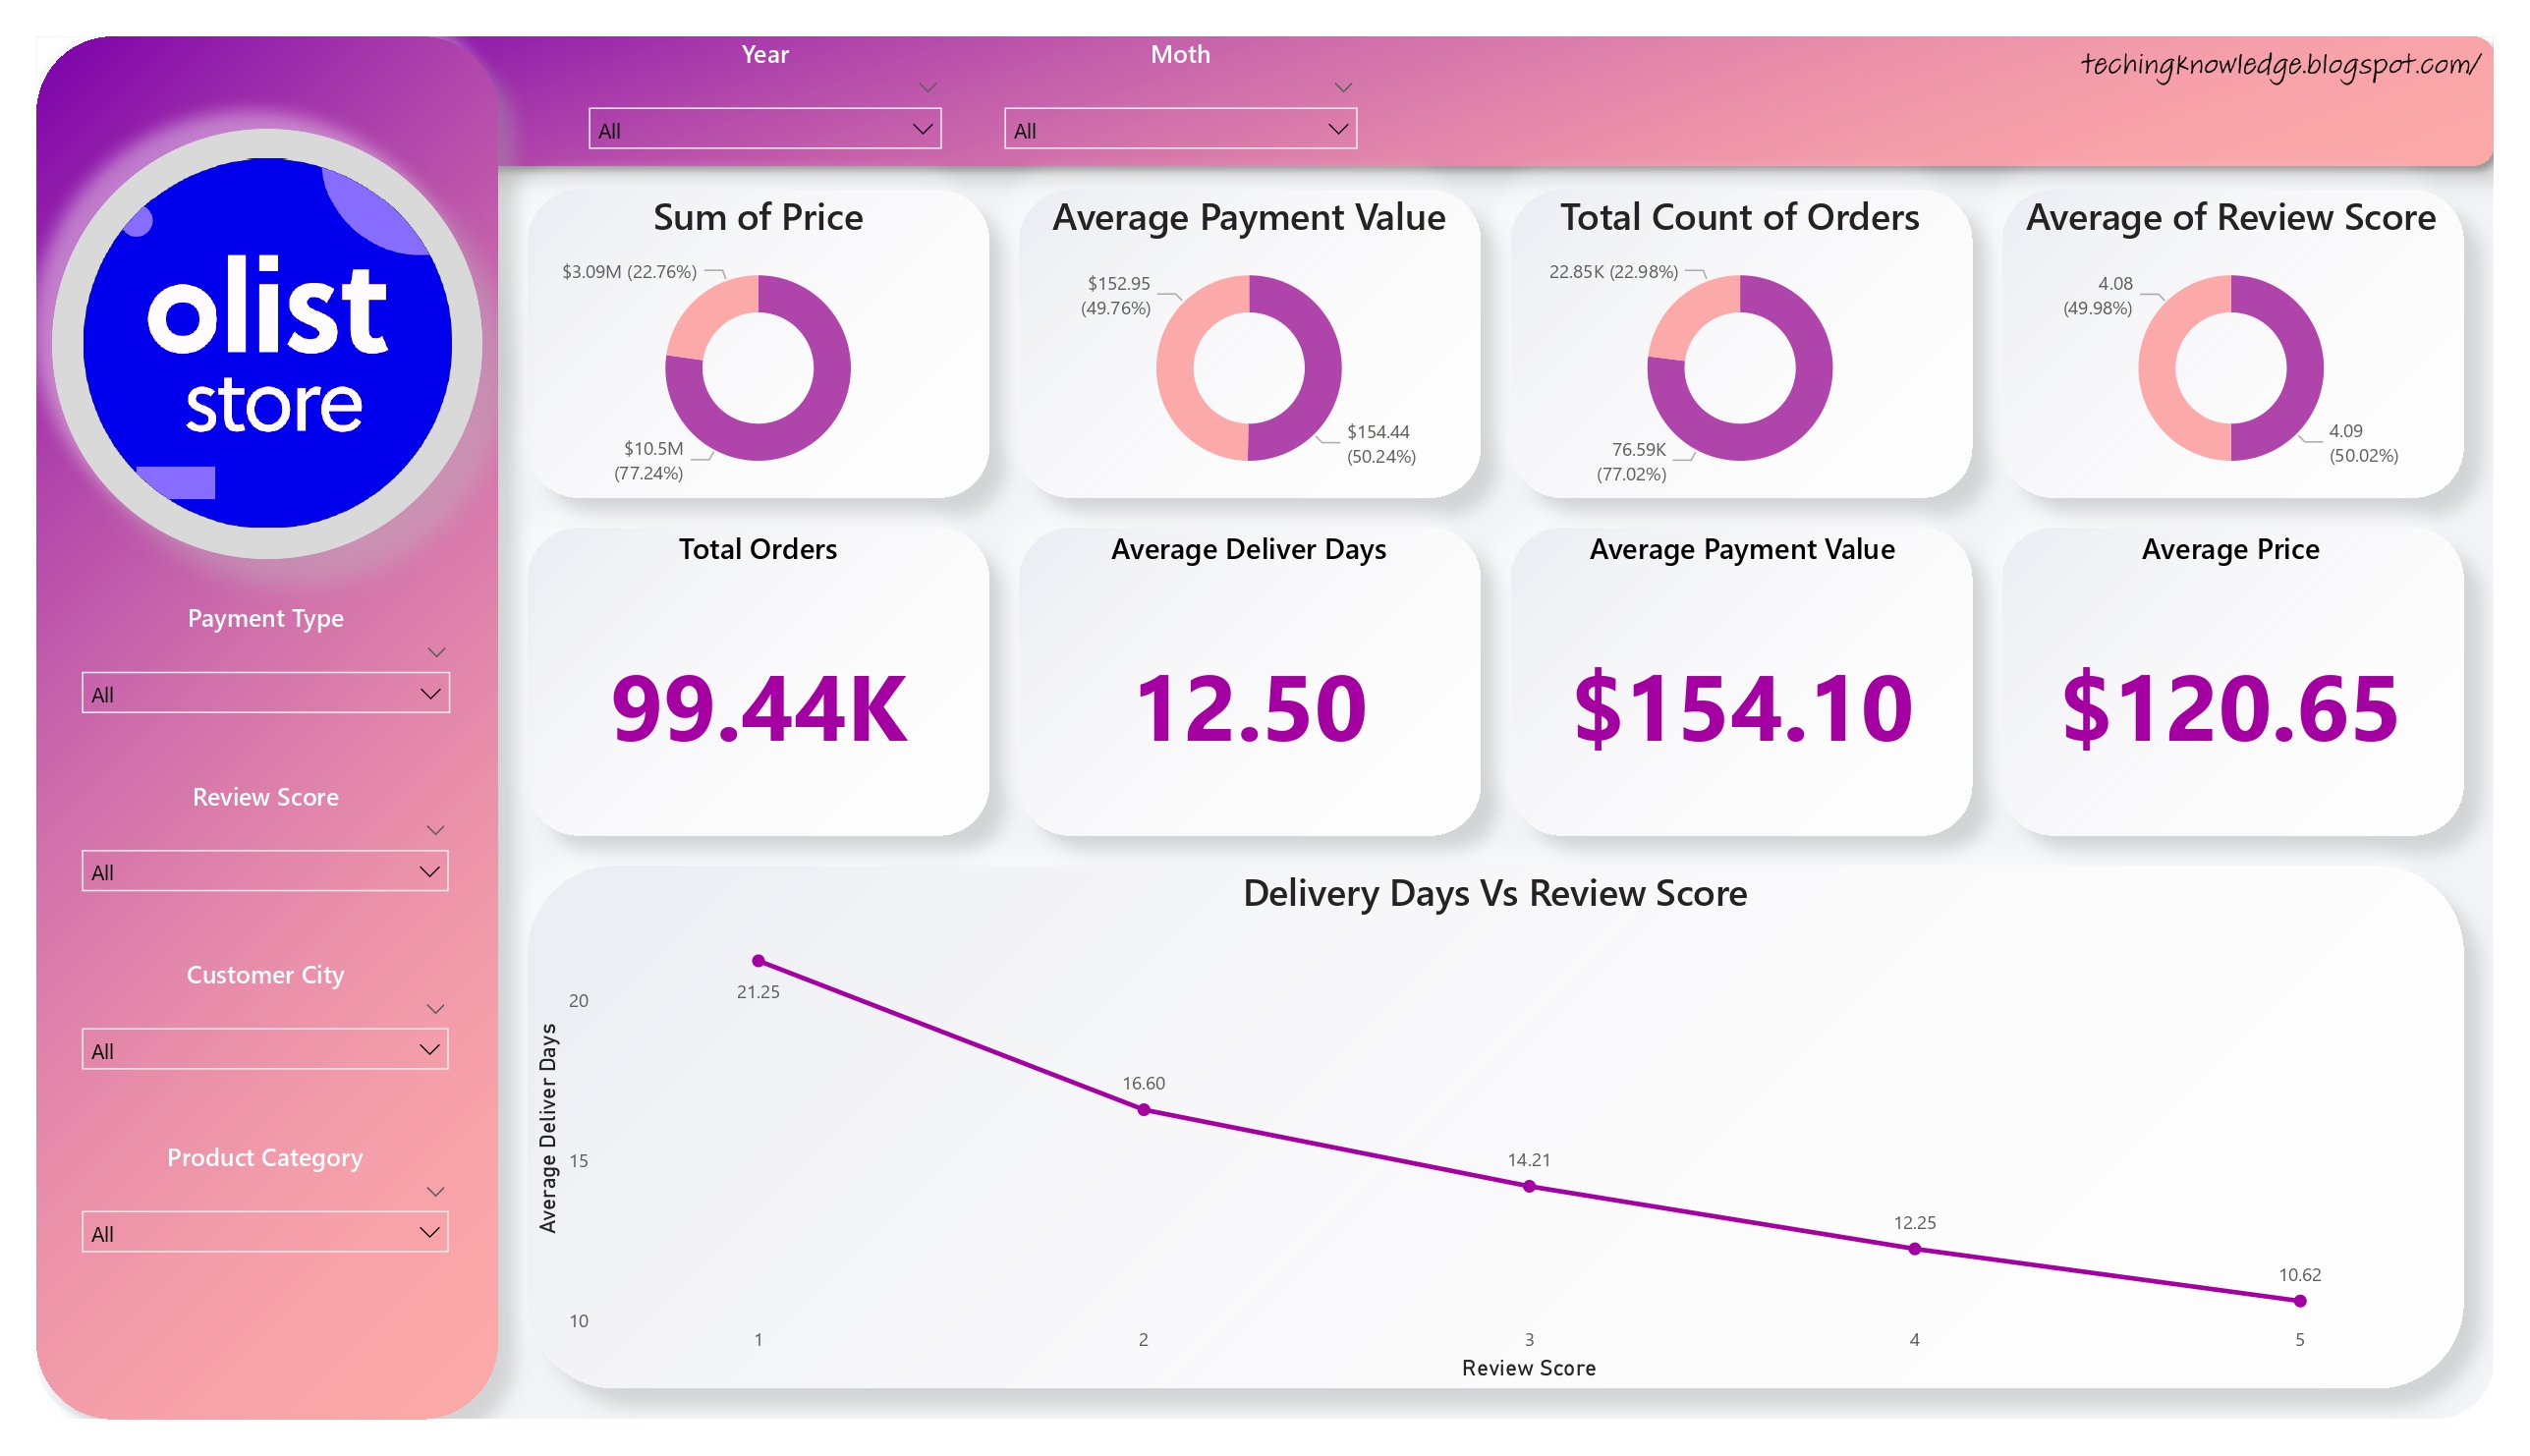
Main dashboard which represents the analysis for the 5 KPI
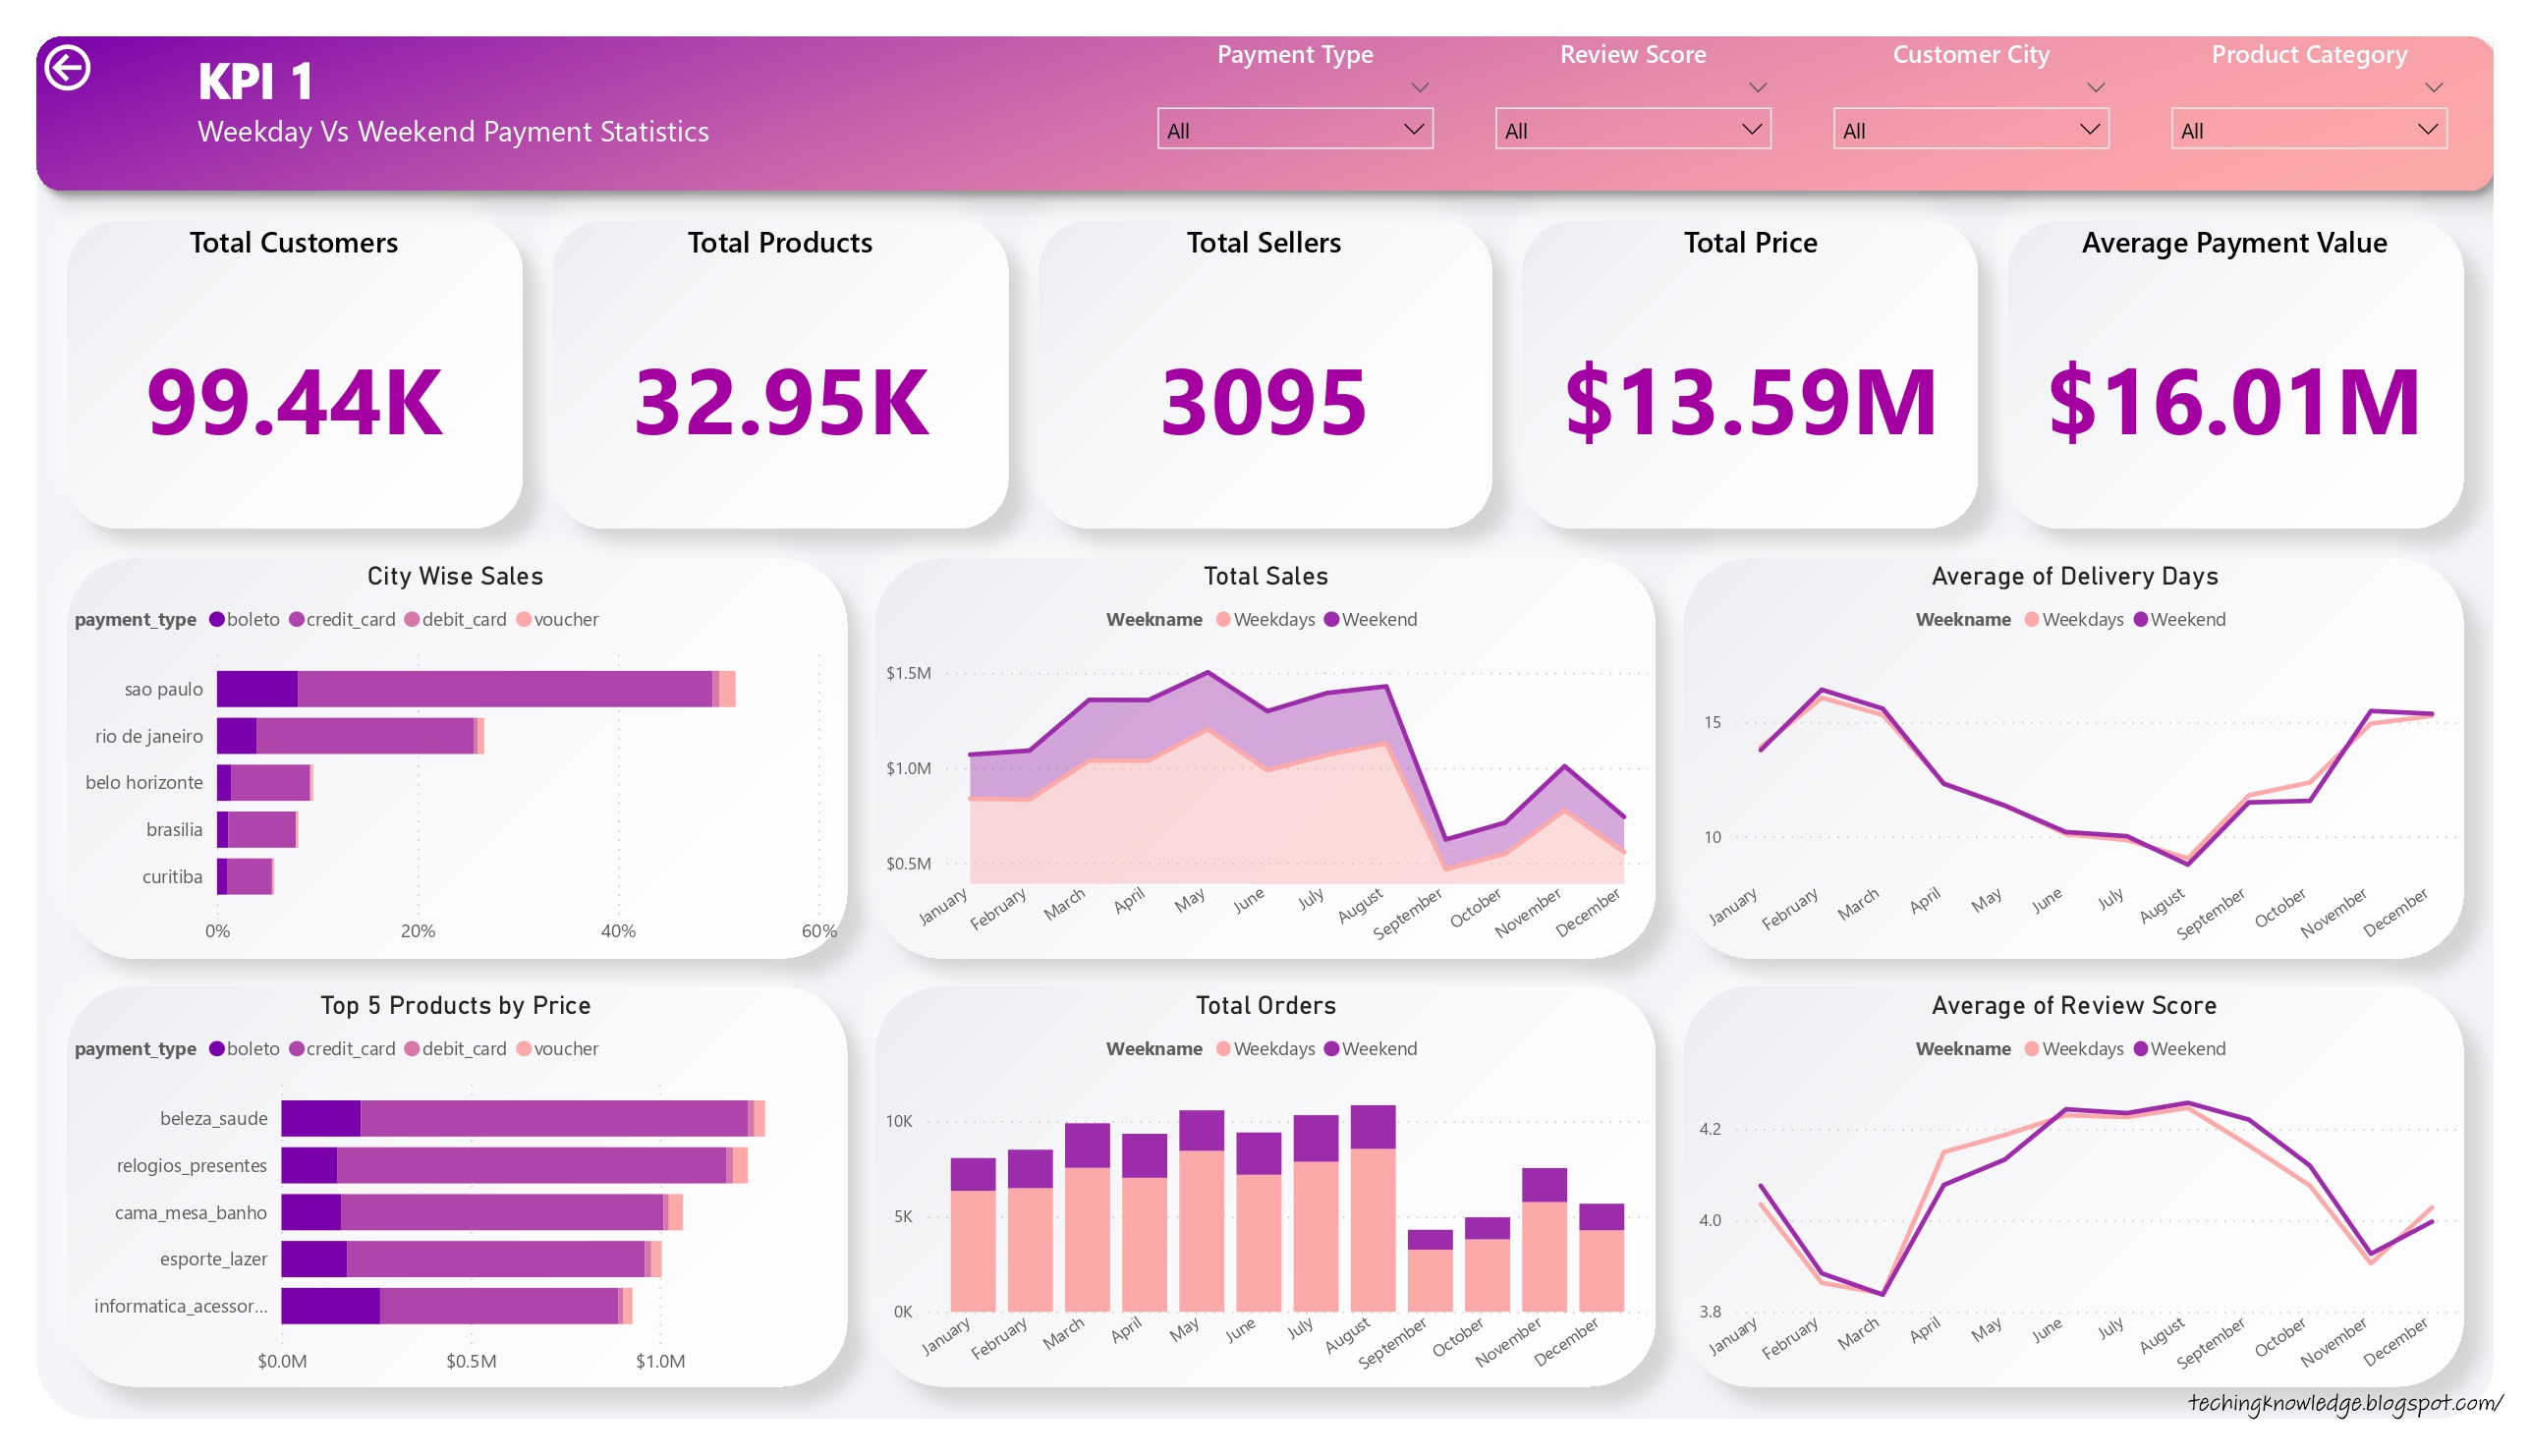
1. Weekday Vs Weekend Payment Statistics
- Total orders, Total Sales, Payment Value is more on weekdays as compared to weekends.
- Maximum sales($1.91M), count of orders(17.80K) & customers(15.54K) are from Sao Paulo city during weekdays & weekends.
- Credit cards are the payment type used by most of the customers(75.24%) with a total payment value of $12.54M.
- Maximum orders are placed during March to August(60.38K) so sales for this month($8.34M) are higher. There is a positive correlation between count of orders & sales.
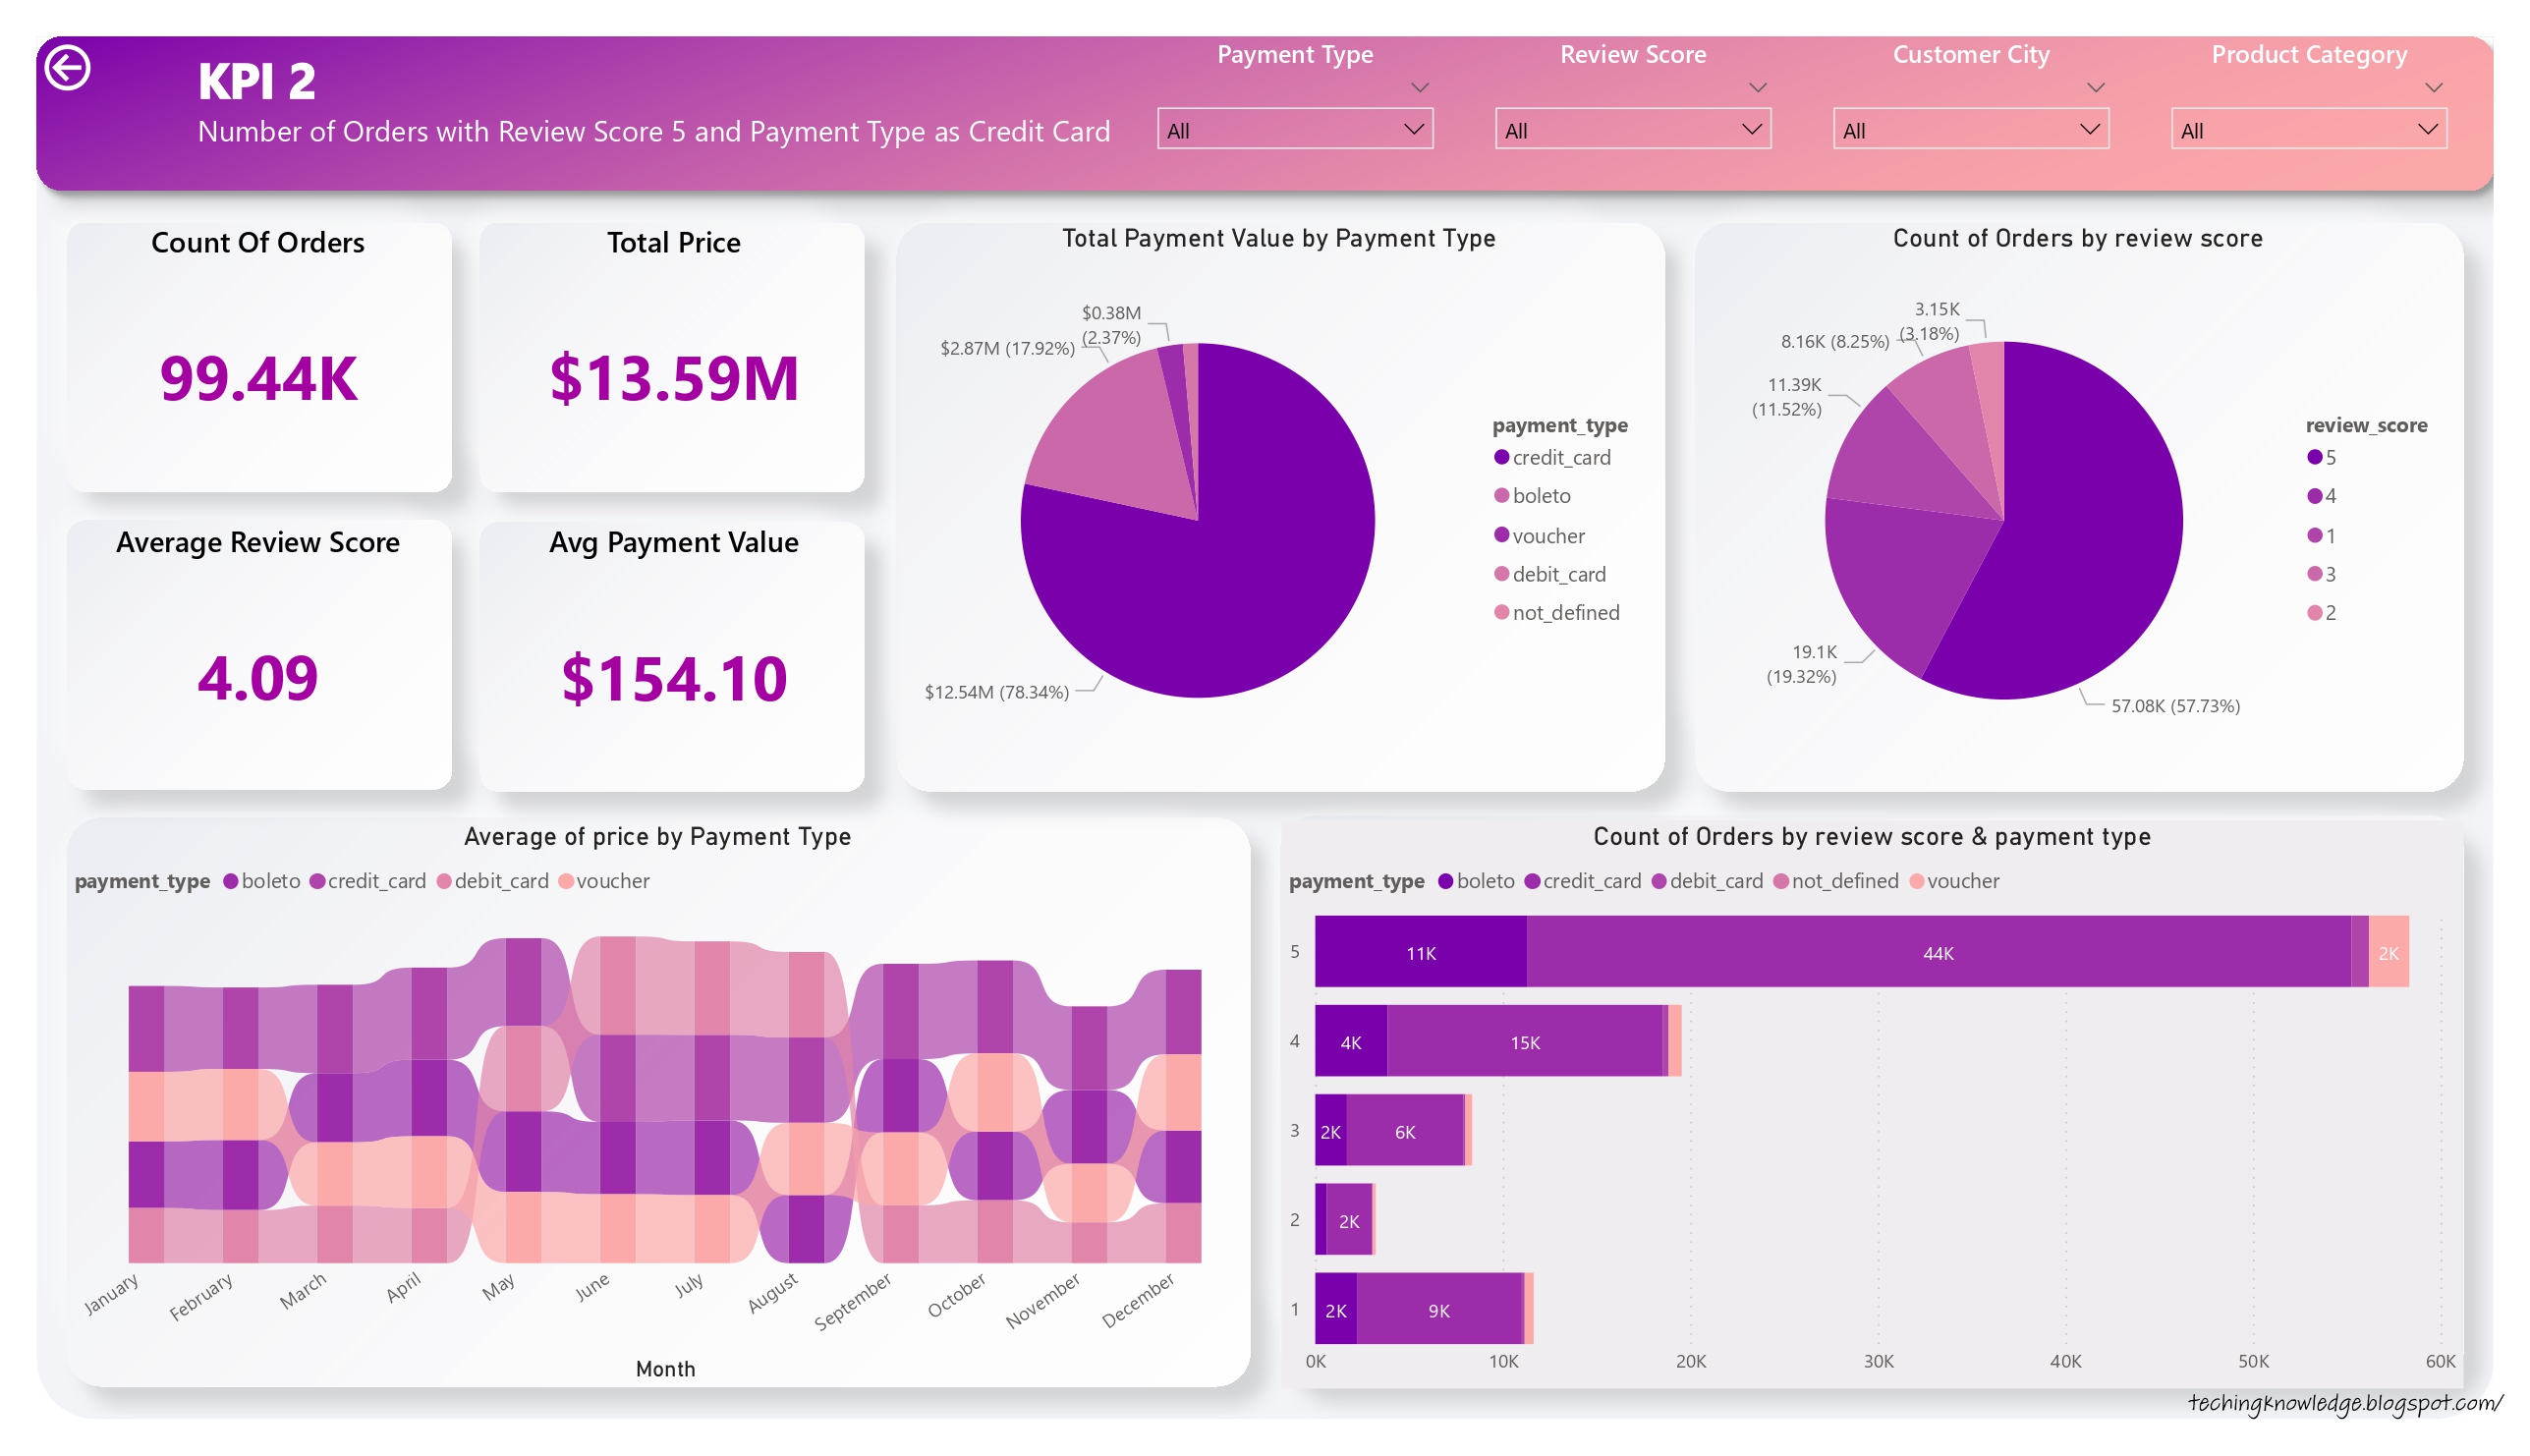
2. Number of Orders with review score 5 and payment type as credit card
- Maximum payment value is done through payment value credit card(78.34%) with payment value $12.54M followed by boleto(17.92%) with payment value $2.87M.
- More than 77% of the orders received review score more than 4 because of which overall review score is 4.09.
- If the payment value of the product is higher then customers preferred installment option which is available on credit card only this is one of the main reasons customers preferred credit card as payment type.
- Bed bath table, health beauty, sports leisure, furniture decor, computer accessories, housewares & watches gifts are the products which were most recommended by customers with average reviews score more than 4.
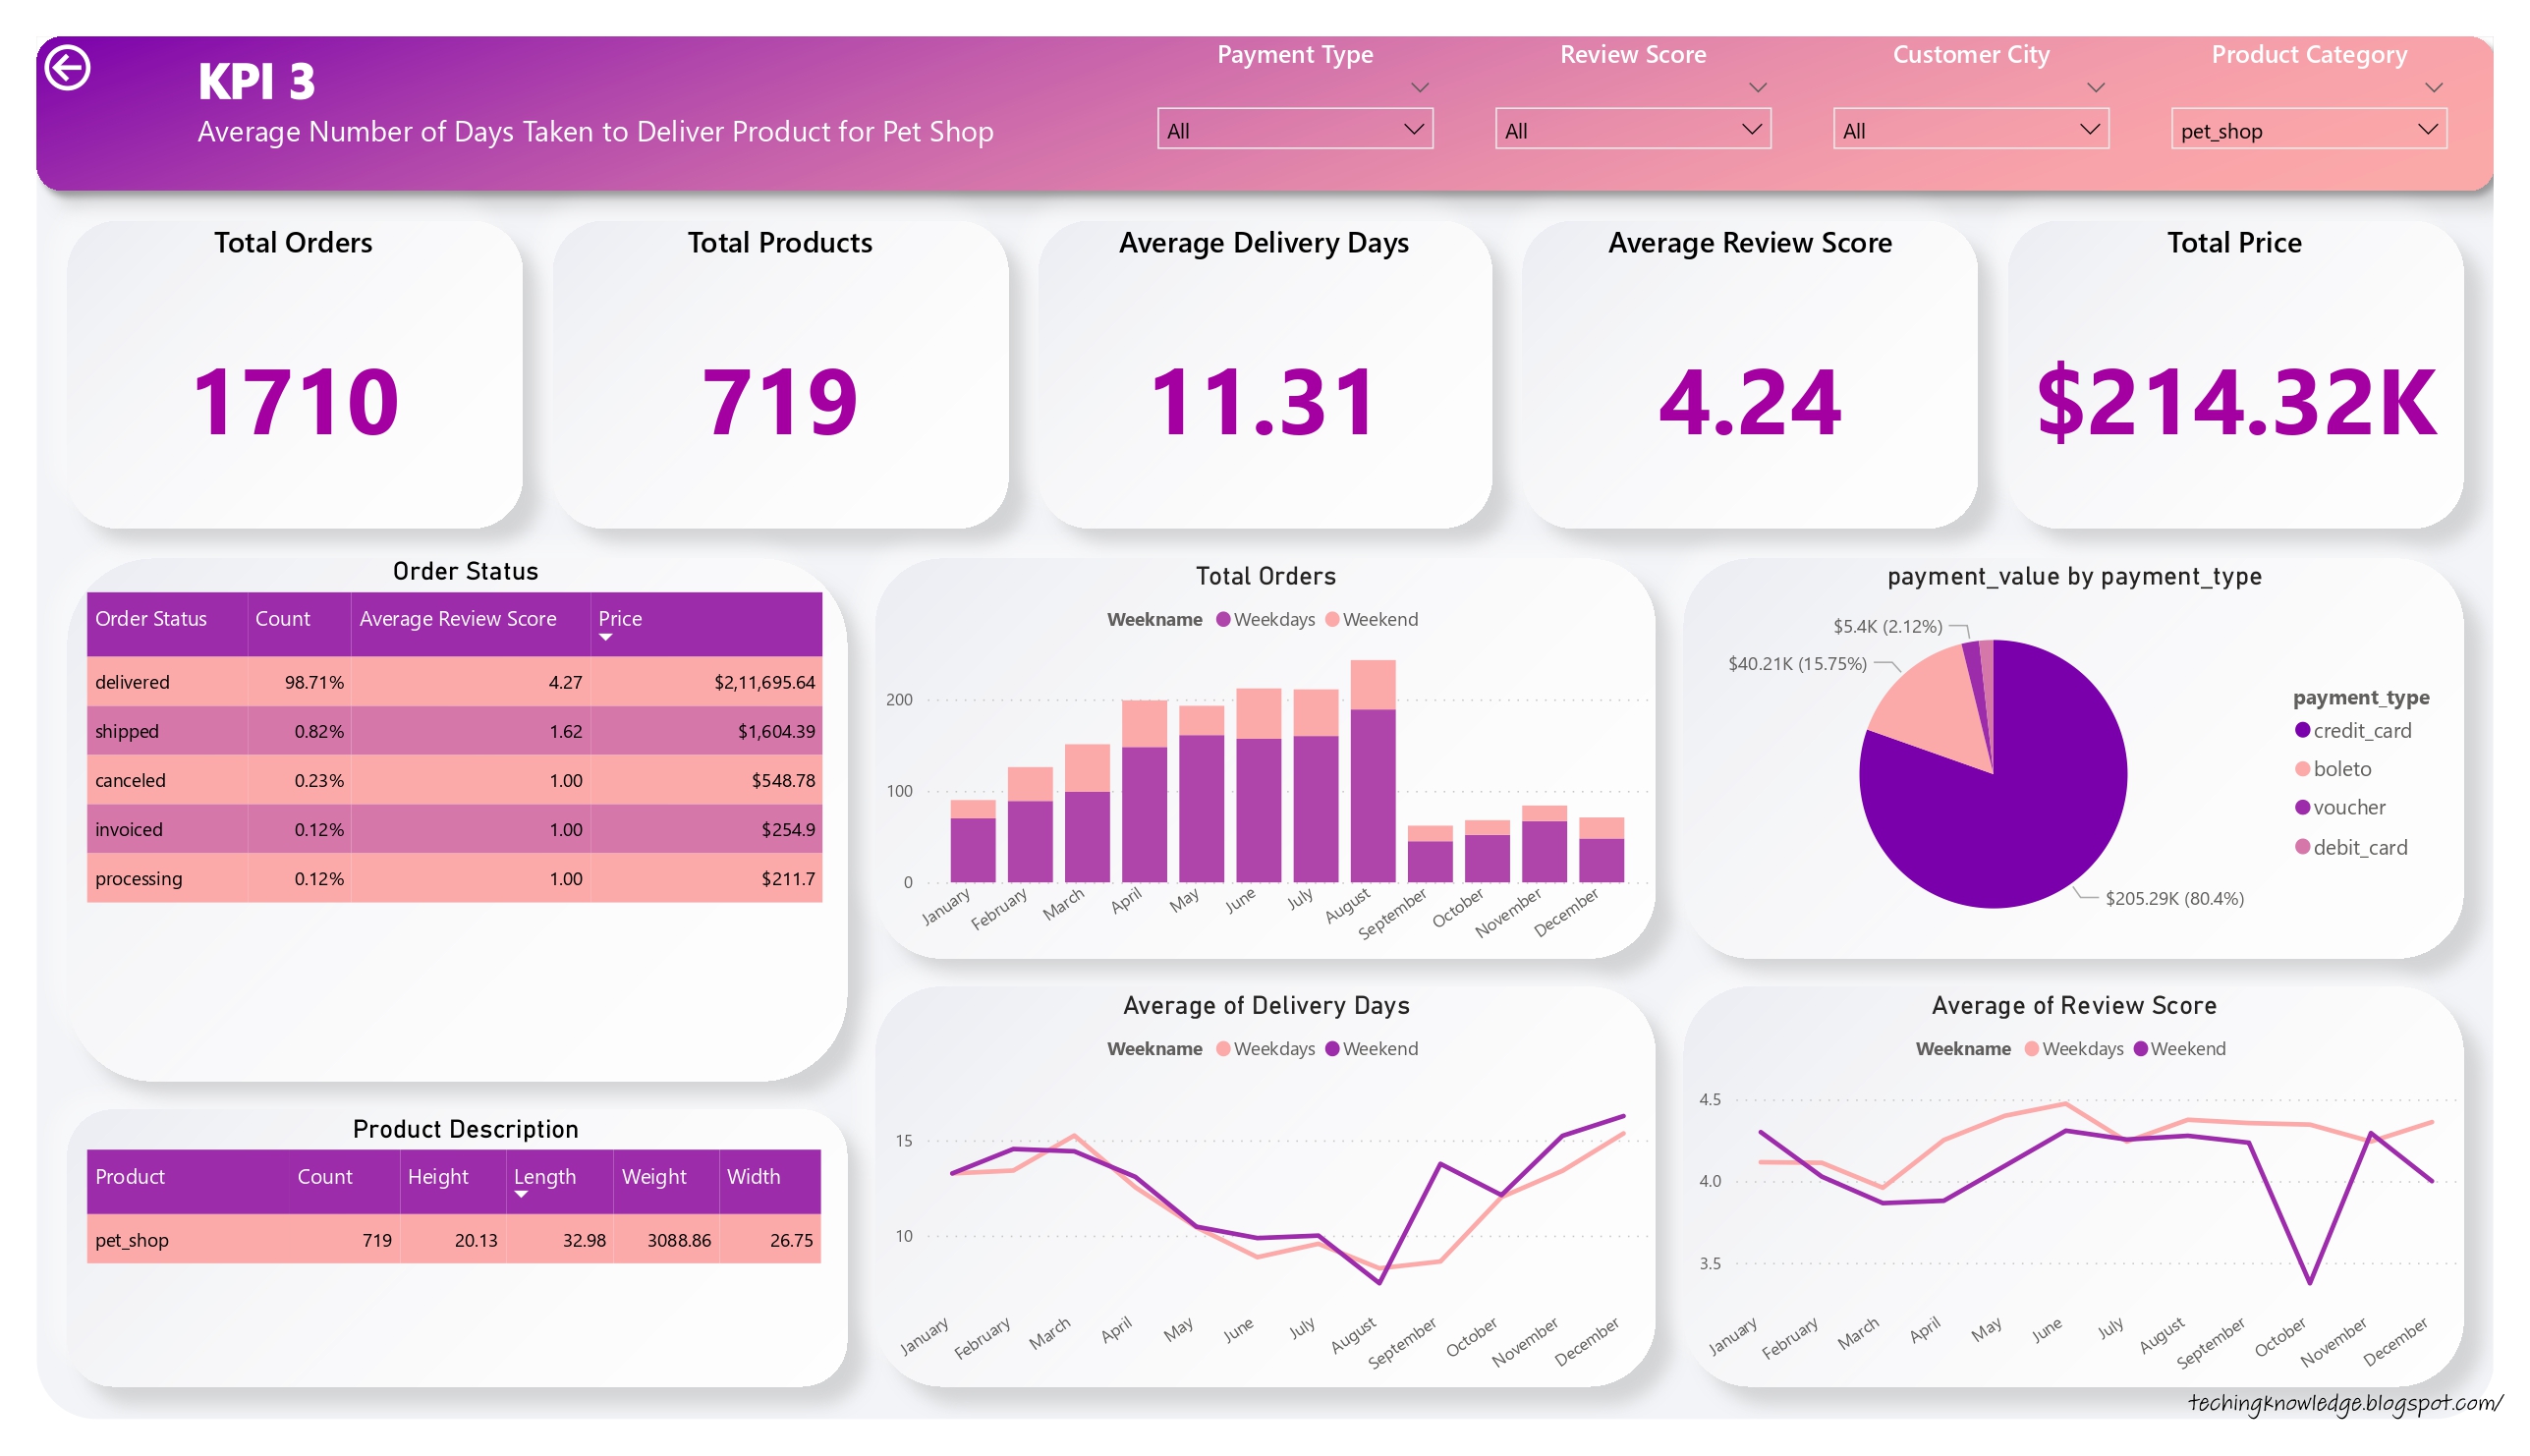
3. Average number of days taken for Pet Shop
- Orders for the Pet Shop category are delivered between 7 to 15 days which brings the average delivery days to approximately 11 days for pet shops.
- Out of 1710 ordered products 1688 products(98.71) are delivered successfully with average delivery days as 11.31 resulting 4.24 as positive review score for pet shop product category.
- Maximum orders for the pet shop category products are placed during April to August months(1058) with total price $131.10K, average delivery day 9.90 & review score 4.31.
- In the month of august delivery days went from 11 to 8 days, in turn rating went up to 4.38 which is above average(4.24).
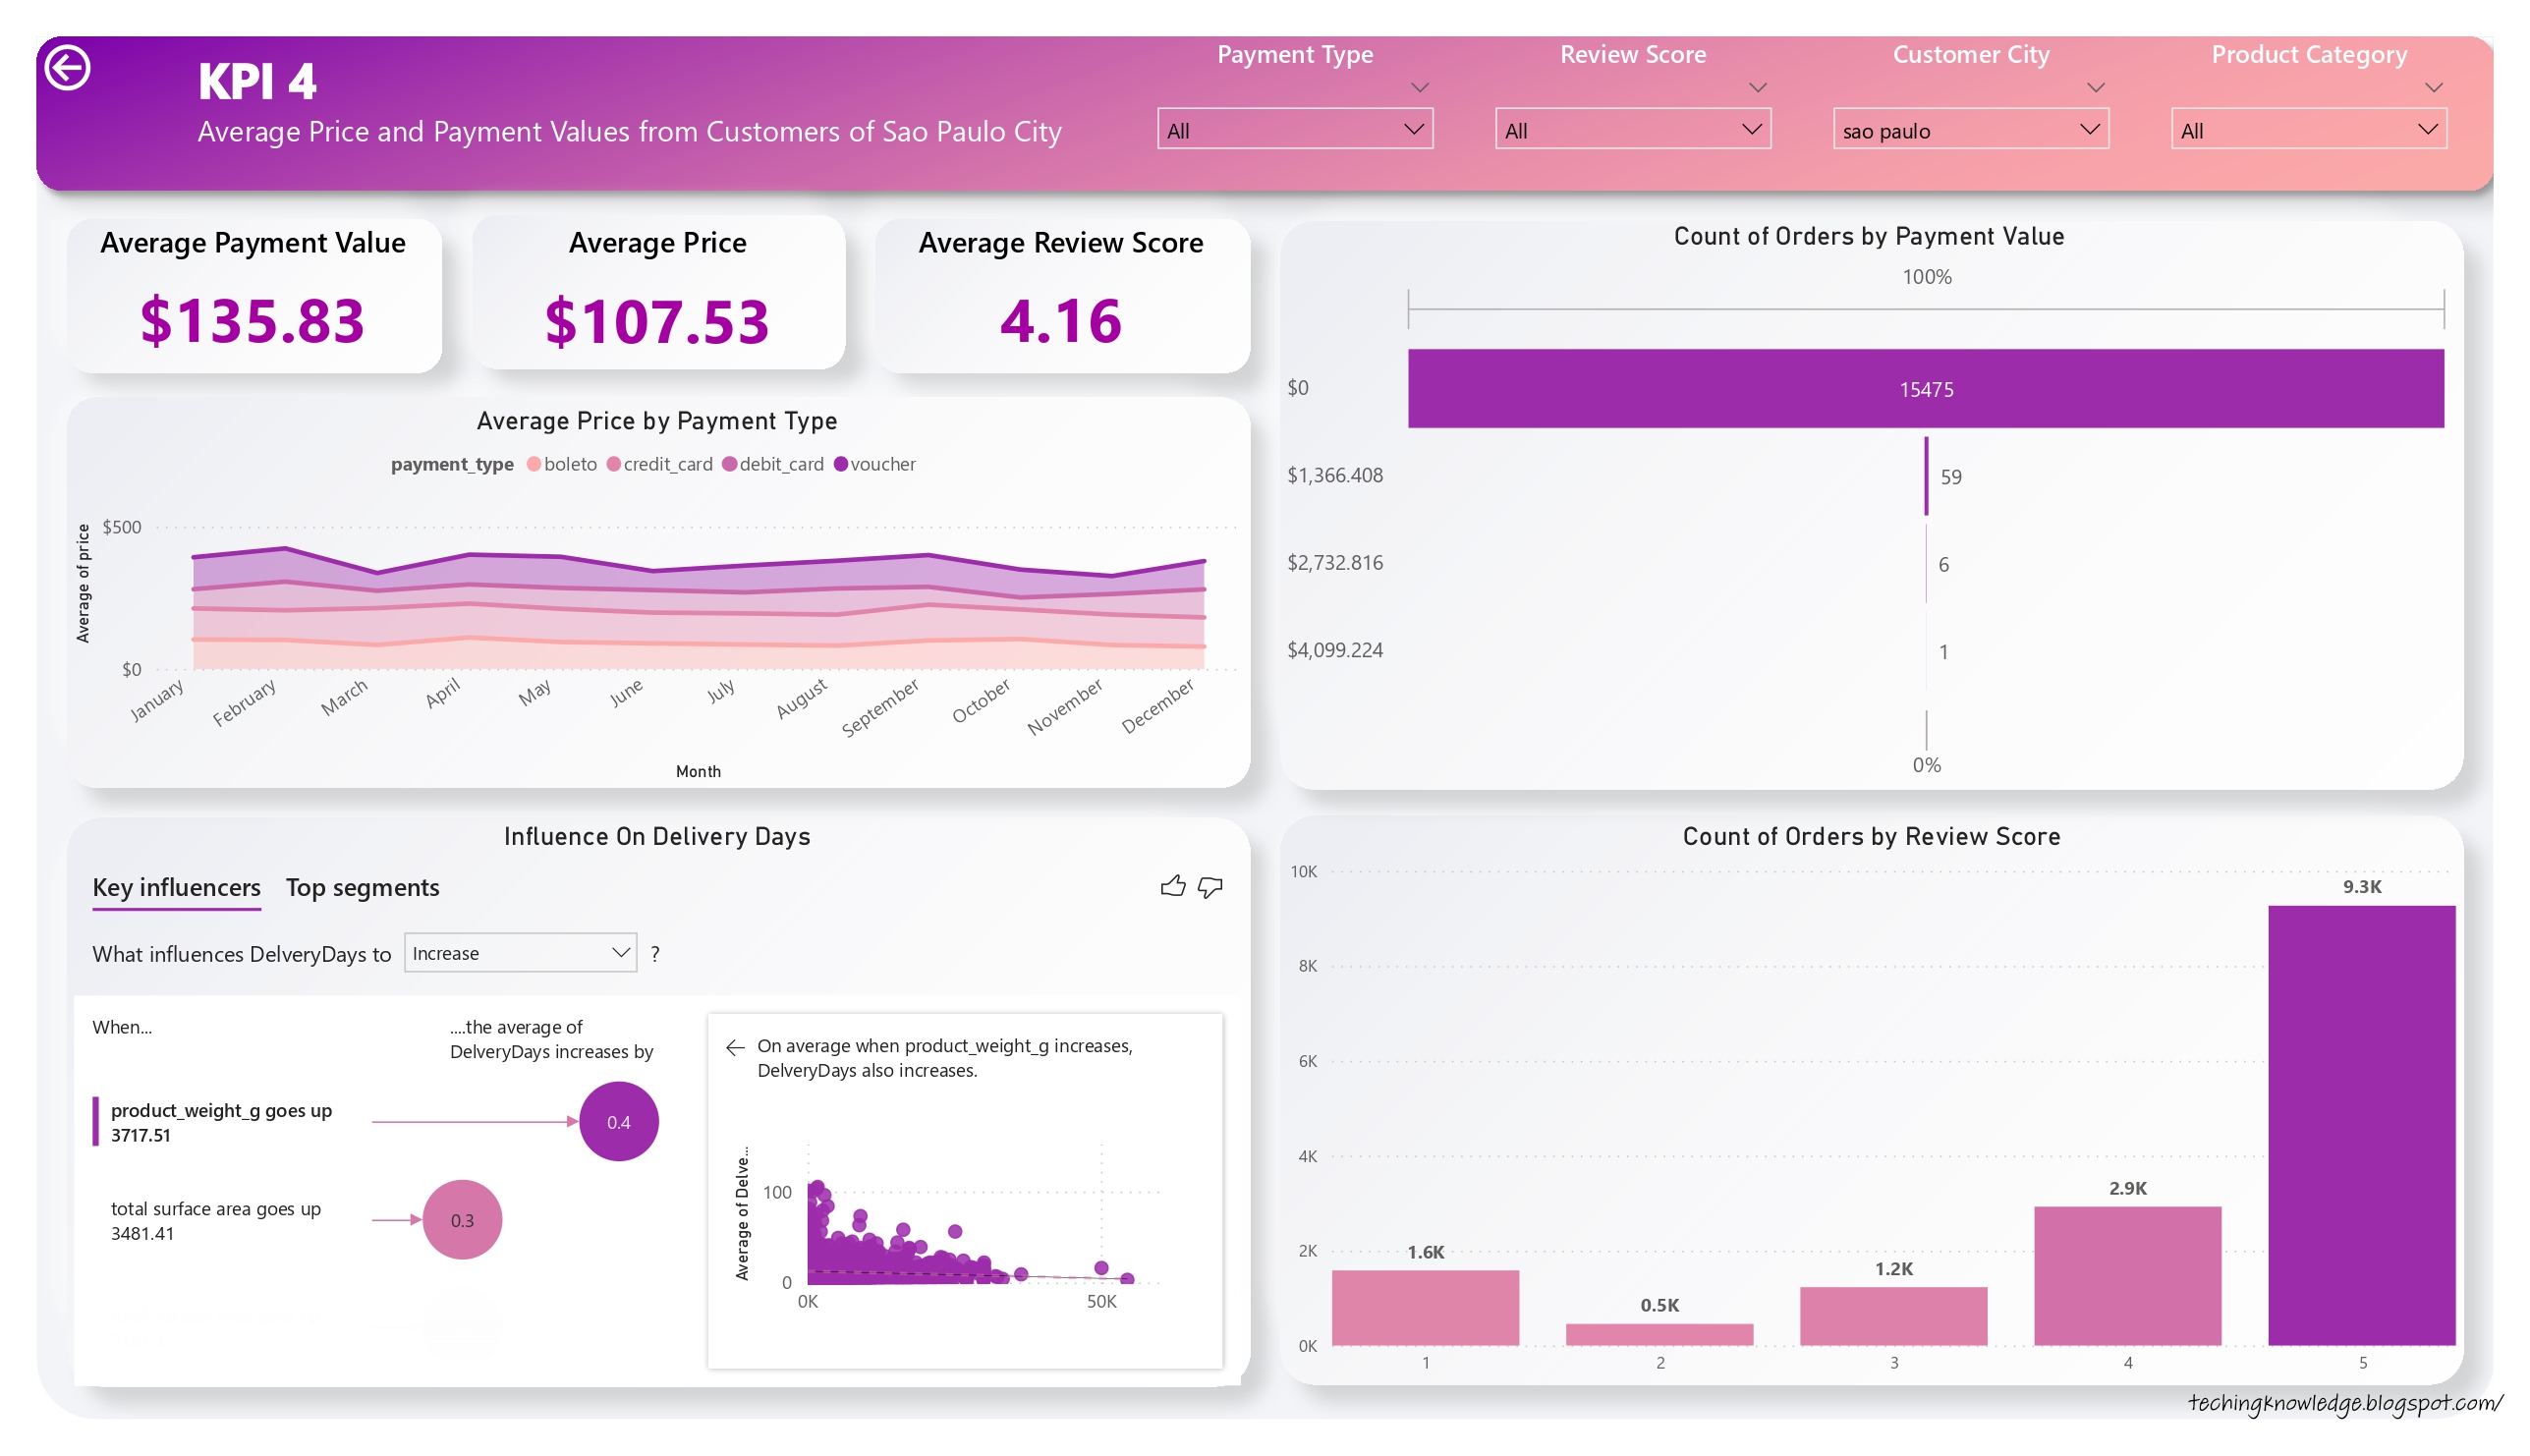
3. Average price and payment values from customers of Sao Paulo city
- The maximum crowd is from Sao Paulo city resulting in 15.62% of total orders being placed from Sao Paulo which contributes to 15.39% of overall sales.
- Around 97.63% of the total order had a price in between $0 to $700, Which brings the overall average price approx. $120.
- Average Review Score is 4.16 because more than 77% of total orders received review score 4 and above.
- Credit card is the most proffered payment type in Sao Paulo with $135.83 average payment value & $1.91M total sales which is 81.51% as compared to other payment types.
- Contribution of Sao Paulo is more as compared to other cities in overall sales($1.91M) and payment value($2.20M).
5. Relationship between shipping days Vs review scores
- Over 76% of orders got more than 3.5 star rating, which is closer to overall average rating of 4.09.
- Delivery days are directly influencing review scores. When delivery days are more than 30, the average review score is 1.87, which is 2.21 units lower than the overall average of 4.09.
- Review score can be increased by working on delivery days. My stats review score is 0.70 points higher when delivery days are less than 11.
- Weight & surface area of product are also influencing delivery days. More than 71% of orders has 12 delivery days, as they weigh from 0gm to 2000 gm & have surface area from 250sq.cm to 3500sq.cm
- As delivery days increase, delivery costs also increase with the exception of a few products.
Conclusion
- Maximum orders are placed between March to August(60.38K) because of which sales during this month are higher($8.34M) which is 61.36% of total sales. Which shows that the store is performing well during this month.
- Currently credit cards are the most preferred payment type by customers which contributes a major role in overall sales(78.44%). To improve sales & to promote other payment types, Olist Store can provide discounts & offers on other payment types.
- Olist Store needs to work more during the last quarter to improve the sales as there are less orders placed during September to December months which also results in less average review score. Store needs to focus on advertisement & different offers on products during the period.
- Maximum customer crowd is from Sao Paulo & Eastern side of the country as compared to other regions. To improve the sales in other regions stores need to focus on campaign & promotion in these regions.
- After observing the comment section we got to know that Bed bath table, health beauty, sports leisure, furniture decor, computer accessories, housewares & watches gifts are the products which receive maximum of the recommendation from customers with average review score 4.08 which shows these are most demanding products among the customers.
- From 5th KPI we can conclude that if sellers take longer days to deliver the product then customers provide less review score which shows it is one the factor that influences review score.
- Sellers should improve on delivery days & should keep customers informed about status of delivery it will make time go much faster for customer and will create personalize experience because they know what's happening.



No comments: