Results for Power BI
Maven Slopes Challenge | Maven Analytics Project

This project is a submission for the #mavenslopeschallenge conducted by Maven Analytics. The aim of the challenge is to build a one-page dashboard that will help users choose their ideal ski resort based on their budget, location, and various other factors. I enjoyed the process of doing data analysis and creating this dashboard using #powerbi.

About the dataset
  • This dataset contains 2 tables in CSV format
  • The Resorts table contains information on 499 ski resorts around the world, including their location, slopes, lifts, prices, and ski season
  • The Snow table contains supplemental data on the surface of the earth covered by snow for each month in 2022, by latitude & longitude
While working on this challenge, I found some helpful insights that will help users find their ideal ski resort destination.
Power BI Dashboard


This dataset included 499 resorts all across 5 continents: Europe, North America, South America, Oceania, and Asia. 72% of global ski resorts are located in Europe, where the average price per person per day is €41.55. North America ranks second, with 19.64% of global ski resorts and an average price per person per day of € 76.97.


Out of 499 resorts 99.20% of resorts are child friendly. If you are planning to ski in the summer season, 29 (5.81%) resorts are available with a summer ski option, and 295 (59.12%) resorts are present where you can plan for night skiing.
Breckenridge is the resort located at the highest point (3914 m) in the United States, with an average daily price of € 140. In Canada, the "Le Massif" resort is located at the lowest point of 36 meters and costs € 51.

Looking for the longest ski run?
The resorts with the longest 16-kilometer runs are Alpe d'Huez (France), Bansko (Bulgaria), and Les Deux Alpes (France). If you are looking for the ski resort with the most difficult slopes, Big Sky Resort (USA) has 126 difficult slopes. Les Sybelles-Le Corier (France) has the most intermediate slopes (239), while Les 3 Vallees (France) has the most beginner slopes (312).


If you're looking for resorts with free entry, consider the following options:
Yellowstone Club(United States)
Alpika Service(Russia)
High1 Resort(South Korea)
Palandoken-Ejder 3200 World Ski Center(Turkey)
Perisher(Australia)
Pragelato(Italy)
Puigmal(France)
Sun Mountain-Yabuli(China)
Uludag-Bursa(Turkey)

If you are planning to visit a ski resort, the best time would be from December to April because the most snow falls during this season.


Some key insights from the above analysis include:
  • Out of the 499 resorts, 99% are child-friendly, 40.88% offer night skiing, and 5.81% offer summer skiing.
  • Europe has 72% of the world's ski resorts, with North America coming in second with 19.64%.South America is at the bottom with seven (1.40%) resorts.
  • Oceania, with 58% of beginners' slope, is suitable for people who are looking for beginners' slope. North and South America are the continents with the most difficult slopes. whereas Europe is suitable for intermediate slopes.
  • Resorts in North America, with an average price of €77, are more expensive as compared to other continents and Asia, with the lowest average price of €33.
  • The best time to plan a visit to a ski resort is between December and April, when the most snow falls.
  • If this is your first trip, Europe is an excellent choice because the majority of the ski resorts are located there, are reasonably priced, and are suitable for intermediate skiers.


Technology Topper Sunday, February 19, 2023
Read more ...
Olist Store Analysis | Power BI Project

Preview
The OLIST STORE is an e-commerce business headquartered in Sao Paulo, Brazil. This firm acts as a single point of contact between various small businesses and the customers who wish to buy their products. In this project We are given multiple tables in CSV format and a schema depicting how these tables are connected. After connecting all the 8 tables, we analyze the entire dataset. It contains multiple categorical and numerical columns and information about 100k orders made at multiple marketplaces between 2016 to 2018.
In this project we are provided with 5 KPI’s on which we have to work & provide answers & solutions by analyzing the dataset. During this project we worked in different phases & tools. Steps involved in this process were data cleaning using power query, data modeling for fact & dimensions table based on the basis of primary & foreign key relationship present in the reference image provided. By using MYSQL Workbench we found the answers for particular KPI by joining the tables using joins concept. Finally to present the in depth analysis for each KPI in the form of an interactive dashboard we used Power BI.

Dataset:
Olist Store Analysis | Power BI Project

Problem Statements(KPI):
  1. Weekday Vs Weekend Payment Statistics
  2. Number of Orders with review score 5 and payment type as credit card
  3. Average number of days taken for Pet Shop
  4. Average price and payment values from customers of Sao Paulo city
  5. Relationship between shipping days Vs review scores
After importing the files in Pier BI I did the analysis on the above given KPI and tried to represent analysis & answers in the form of a dashboard using Power BI.

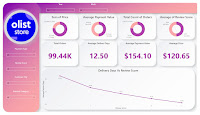
Main dashboard which represents the analysis for the 5 KPI
Olist Store Analysis | Power BI Project

1. Weekday Vs Weekend Payment Statistics
Olist Store Analysis | Power BI Project
  • Total orders, Total Sales, Payment Value is more on weekdays as compared to weekends.
  • Maximum sales($1.91M), count of orders(17.80K) & customers(15.54K) are from Sao Paulo city during weekdays & weekends.
  • Credit cards are the payment type used by most of the customers(75.24%) with a total payment value of $12.54M.
  • Maximum orders are placed during March to August(60.38K) so sales for this month($8.34M) are higher. There is a positive correlation between count of orders & sales.

2. Number of Orders with review score 5 and payment type as credit card
Olist Store Analysis | Power BI Project
  • Maximum payment value is done through payment value credit card(78.34%) with payment value $12.54M followed by boleto(17.92%) with payment value $2.87M.
  • More than 77% of the orders received review score more than 4 because of which overall review score is 4.09.
  • If the payment value of the product is higher then customers preferred installment option which is available on credit card only this is one of the main reasons customers preferred credit card as payment type.
  • Bed bath table, health beauty, sports leisure, furniture decor, computer accessories, housewares & watches gifts are the products which were most recommended by customers with average reviews score more than 4.

3. Average number of days taken for Pet Shop
Olist Store Analysis | Power BI Project
  • Orders for the Pet Shop category are delivered between 7 to 15 days which brings the average delivery days to approximately 11 days for pet shops.
  • Out of 1710 ordered products 1688 products(98.71) are delivered successfully with average delivery days as 11.31 resulting 4.24 as positive review score for pet shop product category.
  • Maximum orders for the pet shop category products are placed during April to August months(1058) with total price $131.10K, average delivery day 9.90 & review score 4.31.
  • In the month of august delivery days went from 11 to 8 days, in turn rating went up to 4.38 which is above average(4.24).

3. Average price and payment values from customers of Sao Paulo city
Olist Store Analysis | Power BI Project
  • The maximum crowd is from Sao Paulo city resulting in 15.62% of total orders being placed from Sao Paulo which contributes to 15.39% of overall sales.
  • Around 97.63% of the total order had a price in between $0 to $700, Which brings the overall average price approx. $120.
  • Average Review Score is 4.16 because more than 77% of total orders received review score 4 and above.
  • Credit card is the most proffered payment type in Sao Paulo with $135.83 average payment value & $1.91M total sales which is 81.51% as compared to other payment types.
  • Contribution of Sao Paulo is more as compared to other cities in overall sales($1.91M) and payment value($2.20M).

5. Relationship between shipping days Vs review scores
Olist Store Analysis | Power BI Project
  • Over 76% of orders got more than 3.5 star rating, which is closer to overall average rating of 4.09.
  • Delivery days are directly influencing review scores. When delivery days are more than 30, the average review score is 1.87, which is 2.21 units lower than the overall average of 4.09.
  • Review score can be increased by working on delivery days. My stats review score is 0.70 points higher when delivery days are less than 11.
  • Weight & surface area of product are also influencing delivery days. More than 71% of orders has 12 delivery days, as they weigh from 0gm to 2000 gm & have surface area from 250sq.cm to 3500sq.cm
  • As delivery days increase, delivery costs also increase with the exception of a few products.

Conclusion
  • Maximum orders are placed between March to August(60.38K) because of which sales during this month are higher($8.34M) which is 61.36% of total sales. Which shows that the store is performing well during this month.
  • Currently credit cards are the most preferred payment type by customers which contributes a major role in overall sales(78.44%). To improve sales & to promote other payment types, Olist Store can provide discounts & offers on other payment types.
  • Olist Store needs to work more during the last quarter to improve the sales as there are less orders placed during September to December months which also results in less average review score. Store needs to focus on advertisement & different offers on products during the period.
  • Maximum customer crowd is from Sao Paulo & Eastern side of the country as compared to other regions. To improve the sales in other regions stores need to focus on campaign & promotion in these regions.
  • After observing the comment section we got to know that Bed bath table, health beauty, sports leisure, furniture decor, computer accessories, housewares & watches gifts are the products which receive maximum of the recommendation from customers with average review score 4.08 which shows these are most demanding products among the customers.
  • From 5th KPI we can conclude that if sellers take longer days to deliver the product then customers provide less review score which shows it is one the factor that influences review score.
  • Sellers should improve on delivery days & should keep customers informed about status of delivery it will make time go much faster for customer and will create personalize experience because they know what's happening.


Technology Topper Tuesday, November 29, 2022
Read more ...
Maven Pizza Challenge - Maven Analytics | Power BI Project

For the Maven Pizza Challenge, playing the role of a BI Analyst by Plato's Pizza, a Greek-inspired pizza place in New Jersey. Designed a dashboard to analyze & help the restaurant use data to improve operations. Found some useful insight & answer for the question provided in the challenge by creating the interactive dashboard in Power BI.
The data was provided by Maven as a part of the challenge. It was contained in 4 .csv files, named Orders, Order Details, Pizzas, and Pizza type. The dataset was already clean so there was no need to do anything else in this step of the process.


About the dataset:
  • This dataset contains 4 tables in CSV format
  • The Orders table contains the date & time that all table orders were placed
  • The Order Details table contains the different pizzas served with each order in the Orders table, and their quantities
  • The Pizzas table contains the size and price for each distinct pizza in the Order Details table, as well as its broader pizza type
  • The Pizza Types table contains details on the pizza types in the Pizzas table, including their name as it appears on the menu, the category it falls under, and its list of ingredients

For the analysis I have imported tables in power BI. I have done the data modeling in Power BI by connecting the 4 tables based of primary & foreign key. After connecting the table I did the analysis for the given problem statements by maven analytics. Below is the Power BI dashboard which I have created to show the analysis for the Maven Pizza challenge.

DASHBOARD
  • Plato's Pizzas is open from 9:00 a.m. to 11:00 p.m. every day of the week.They have 4 pizza categories and 32 pizza types in 5 different sizes.
  • A total of 21.35K pizza orders were placed, and a total of 48.75K pizzas were sold, with an average of 2.32 pizzas per order.
  • The busiest day is Friday because the majority of orders are placed on this day, and the busiest time for the store is between 12 and 1 p.m.
  • Classic-type pizza is the category that is ordered by most of the customers (29.9%), followed by supreme, veggie, and chicken. Large-size pizza is preferred by most of the customers, followed by medium, small, XL, and XXL.
  • The bestselling pizza was the "Classic Deluxe Pizza" (2453 orders), and the lowest selling pizza was the "Brie Carre Pizza" (490 orders).


Technology Topper Tuesday, November 29, 2022
Read more ...