Data Visualisation: Empowering Business with Effective Insights

logo

This virtual experience program is with Tata Insights and Quants or Tata iQ hosted on the platform Forage. We will gain insight into how passionate multi-disciplinary experts solve some of the most complex business problems using data visualization solutions, such as Tableau and Power BI and create amazing stories which are hidden under the mountains of data generated.

The program will show you what kind of problems are solved at Tata Insights and Quants on a day-to-day basis and will attempt to emulate the challenges you will be facing.

As a consultant hired by an online retail store, I was tasked with reviewing their data and providing valuable insights to the CEO and CMO. The objective was to analyze the major contributing factors to the company's revenue to help them plan strategically for the next year. The leadership wanted to view the metrics from both an operations and marketing perspective and seek guidance on areas performing well, so they could focus on what's working. They were also interested in understanding different metrics based on demographic information available in the data.

Task 1: Framing the Business Scenario
Learn how to anticipate the questions your business leaders will need answers to.

To prepare for the upcoming meeting with the CEO and CMO, I approached the task with a business leader's mindset, aiming to analyze the data effectively and present insights that would help evaluate the current business performance and suggest metrics for expansion.

I accessed the provided resources to better understand how business leaders think and approach business performance, which helped me gain valuable perspectives.

To prepare for your meeting, I need to draft questions that will be important and relevant to the CEO and CMO. I have reviewed the provided dataset to identify valuable information and insights. Based on my analysis, I have drafted four questions each for both the CEO and CMO, considering their distinct perspectives.

Questions for the CEO:
  1. What are the top-performing product categories in terms of revenue, and how have they evolved over the past year? Are there any specific trends or seasonal patterns that stand out?
  2. What regions or countries have shown the highest revenue growth, and what strategies have been employed in those regions to achieve such success? How can we replicate these strategies in other markets?
  3. How has the customer retention rate changed over the last year, and what initiatives have been implemented to improve customer loyalty? What can we do to further increase customer retention and lifetime value?
  4. What is the profitability breakdown across different customer segments, and which segments contribute the most to our overall revenue? Are there any untapped customer segments with growth potential?
Questions for the CMO:
  1. How effective have our marketing campaigns been in terms of customer acquisition and conversion rates? Which marketing channels have yielded the highest returns, and how can we optimize our marketing budget allocation?
  2. What are the key demographic insights of our customer base? How do different demographics (age, gender, location, etc.) impact customer behavior and preferences, and how can we tailor our marketing strategies accordingly?
  3. Are there any notable changes in customer sentiment or brand perception based on online reviews and feedback? How can we address any negative sentiment and leverage positive feedback to strengthen our brand image?
  4. What role does social media play in our revenue generation, and which platforms have been most impactful? How can we leverage social media influencers and user-generated content to expand our reach and engage with our target audience effectively?

By addressing these questions during the meeting, I intend to provide the CEO and CMO with actionable insights that will guide their decision-making process, help them evaluate the current business performance, and support their plans for strategic expansion.


Task 2: Choosing the Right Visuals
Learn which visuals are most effective in a given scenario.

In this task, I was tasked with providing visualizations to the CEO and CMO of an online retail store. The goal was to help them understand the company's performance, identify key strengths, and uncover growth opportunities for increased revenue. To ensure accurate representation of the data, I carefully gathered the requirements and created simple yet effective visuals. By using appropriate charts such as line graphs, bar graphs, map charts, I presented insights on sales trends, product category distribution, and correlations between marketing expenditure and revenue. The objective was to enable the senior management to quickly grasp the company's performance and make informed decisions for future growth and success.


Task 3: Creating Effective Visuals
Apply your under and create visuals based on business scenarios.

In this task, I have to create the visuals around four of the questions that the CEO and CMO have requested. In this task I used Tableau for the data visualization and to create a charts for the respective KPI.

Data cleanup
Before proceeding to data analysis there is a need for data cleanup. I observed that there were some negative values present in the quantity & price field that I have removed.
Also the client has provided 2 conditions for the data analysis.
  • Create a check that the quantity should not be below 1 unit
  • Create a check that the Unit price should not be below $0

Question 1
The CEO of the retail store is interested to view the time series of the revenue data for the year 2011 only. He would like to view granular data by looking into revenue for each month. The CEO is interested in viewing the seasonal trends and wants to dig deeper into why these trends occur. This analysis will be helpful for the CEO to forecast for the next year.


According to my analysis, there are some months of the year that experience exceptional growth. According to the data, the first eight months' revenue were relatively stable, with an average of $685k in revenue each month. The revenue rises by 40% over the prior month in September, marking the beginning of the revenue increase. This pattern persisted up until November, when it reached 1.5 million USD, the highest amount of the entire year. Unfortunately, since the data for December has been missing, no inferences can be made from it. This analysis shows how seasonality, which usually happens in the last four months of the year, impacts retail store sales.

Question 2
The CMO is interested in viewing the top 10 countries which are generating the highest revenue. Additionally, the CMO is also interested in viewing the quantity sold along with the revenue generated. The CMO does not want to have the United Kingdom in this visual.


The second visual shows how the top 10 countries which have opportunities for growth are performing. This data does not include the UK as the country already has high demand and I’ve been told you’re more focused on the countries where demand can be increased. The analysis shows that countries such as the Netherlands, Ireland, Germany and France have high volumes of units bought and revenue generated. I would suggest that these countries should be focused on to ensure that measures are taken to capture these markets even more.


Question 3
The top 10 countries with the most potential for growth are represented in the second graph. Since the UK already has a high demand and I understand you are more interested in countries where demand can be increased, the UK is not included in this data. According to the analysis, sales of units and revenue are very high in nations like the Netherlands, Ireland, Germany, and France. To ensure that steps are taken to further seize these markets, I would propose concentrating on these nations.


The top 10 customers who have made the most purchases from the store have been the focus of the third analysis. According to the data, there aren't many differences between the top 10 customers' purchases. The fact that the highest revenue-producing customer only spent 17% more than the second-highest demonstrates that the company does not rely solely on a small number of customers to generate revenue. This demonstrates that the company is in a strong position and that the customer's power of negotiation is low.


Question 4
The CEO is looking to gain insights on the demand for their products. He wants to look at all countries and see which regions have the greatest demand for their products. Once the CEO gets an idea of the regions that have high demand, he will initiate an expansion strategy which will allow the company to target these areas and generate more business from these regions. He wants to view the entire data on a single view without the need to scroll or hover over the data points to identify the demand. There is no need to show data for the United Kingdom as the CEO is more interested in viewing the countries that have expansion opportunities.


The map chart concludes by comparing the regions that have produced the most revenue to those that have not. Apart from the UK, it is clear that nations like the Netherlands, Ireland, Germany, France, and Australia generate high revenue, and the business should invest more in these nations to boost product demand. The map also reveals that the majority of sales occur exclusively in the European region, with only a small number in the American region. Along with Russia, there is no market for the products in Africa or Asia. Sales revenues and profitability could increase with the implementation of a fresh strategy focused on these areas.


Task 4: Communicating Insights and Analysis
Effectively communicate your findings and explain how it relates to each scenario.


In this task I represented my thought process and how I handled the data cleanup and visualisation phase. I clearly presented the analysis of all four questions from the previous task raised by CEO & CMO and provided context for each scenario and how it relates to their questioning.


Technology Topper Wednesday, August 02, 2023
Read more ...

Maven Northwind Challenge | Maven Analytics Project

Introduction:
This project is a submission for the #mavennorthwindchallenge conducted by Maven Analytics. As a BI developer at Northwind Traders, I have been given the exciting responsibility of creating a comprehensive KPI dashboard for our executive team. This dashboard will serve as a valuable tool for them to gain quick insights into our company's performance across various crucial areas. These areas include:
  • Sales trends
  • Product performance
  • Key customers
  • Shipping costs
By presenting this information in an easily digestible format, the executive team can make informed decisions and steer the company towards continued success.
Talking about dataset it includes 7 tables in the form of csv format which contains Sales & order data for Northwind Traders, food supplier, including information on customers, products, orders, shippers, and employees.

In today's highly competitive business landscape, companies rely on data-driven insights to make informed decisions and stay ahead of the curve. Northwind Traders, a leading global import and export company specialising in gourmet food products, understands the value of data analysis in driving success. As a BI developer for Northwind Traders, I had the opportunity to build a comprehensive KPI dashboard that provides the executive team with a bird's-eye view of the company's performance across crucial areas. In this blog post, we will delve into the key features and insights offered by this powerful dashboard.

Maven Northwind Challenge Tableau Dashboard
Maven Northwind Challenge


Sales Trends:
Understanding sales trends is vital for any business. Northwind Traders' KPI dashboard provides a clear visualisation of sales performance over time. Executives can quickly identify patterns, seasonal fluctuations, and growth areas. By analysing sales trends, they can make strategic decisions regarding inventory management, marketing campaigns, and sales projections.
Total sales done by Northwind Traders were $1.35M from Q3 of 2013 to Q2 of 2015, with total orders of 830. The highest sale was done in 2015 Q1, i.e., $57K, with the highest orders of 182.
The total sales for the Northwind Traders are increasing year over year.

Year

Total Sales

2014

$82,791.05

2015

$77,930.02

2013

$26,231.00


Product Performance:
The success of individual products can significantly impact a company's overall revenue. With the KPI dashboard, Northwind Traders' executives gain a comprehensive understanding of product performance. They can assess sales volume, revenue generated, and profitability for each product category. Armed with this information, they can optimise the product portfolio, identify top-performing items, and strategically allocate resources to drive growth.
There were a total of 77 products sold in 8 product categories. The highest product sold was Raclette Courdavault, with $76.3K. According to sales, the Cote de Blaye is the product with the highest sales of $149.98K. The most popular product category was beverages, with a total quantity sold of 404 and total sales of $286.55K.

Key Customers:
Maintaining strong relationships with key customers is crucial for sustainable business growth. The KPI dashboard highlights the company's most valuable customers based on various metrics such as revenue generated, repeat purchases, and customer loyalty. This insight allows executives to focus on nurturing these relationships, tailoring offerings to their specific needs, and identifying potential upsell or cross-sell opportunities.
Northwind Traders has a total of 91 customers across 21 countries. The United States has the most customers, followed by Germany. The top customer for the Northwind Traders was Hanari Carnes, with total sales of $18.3K.

Shipping Costs:
Efficient supply chain management is a critical factor in maximising profitability. The dashboard provides a detailed breakdown of shipping costs, enabling executives to identify areas of potential cost savings, optimise logistics, and negotiate better terms with shipping providers. This information helps Northwind Traders streamline operations and enhance overall profitability.
There are three shippers who supply the food products for the Northwind Traders. United Package Shipper Company supplied the maximum 326 products with the highest total sales of $89.94K, followed by Federal Shipping with total sales of $50.50K in 2nd place and Speedy Express in 3rd place with total sales of $46.51K.

Conclusion:
Northwind Traders' KPI dashboard equips the executive team with a comprehensive overview of the company's performance in key areas. By leveraging data visualisations and actionable insights, executives can make informed decisions, drive growth, and maintain a competitive edge in the gourmet food industry. This powerful tool empowers Northwind Traders to monitor sales trends, evaluate product performance, nurture key customer relationships, and optimise shipping costs. With a data-driven approach, Northwind Traders is well-positioned to continue its success and expand its global reach.


Technology Topper Sunday, May 21, 2023
Read more ...
Maven Slopes Challenge | Maven Analytics Project

This project is a submission for the #mavenslopeschallenge conducted by Maven Analytics. The aim of the challenge is to build a one-page dashboard that will help users choose their ideal ski resort based on their budget, location, and various other factors. I enjoyed the process of doing data analysis and creating this dashboard using #powerbi.

About the dataset
  • This dataset contains 2 tables in CSV format
  • The Resorts table contains information on 499 ski resorts around the world, including their location, slopes, lifts, prices, and ski season
  • The Snow table contains supplemental data on the surface of the earth covered by snow for each month in 2022, by latitude & longitude
While working on this challenge, I found some helpful insights that will help users find their ideal ski resort destination.
Power BI Dashboard


This dataset included 499 resorts all across 5 continents: Europe, North America, South America, Oceania, and Asia. 72% of global ski resorts are located in Europe, where the average price per person per day is €41.55. North America ranks second, with 19.64% of global ski resorts and an average price per person per day of € 76.97.


Out of 499 resorts 99.20% of resorts are child friendly. If you are planning to ski in the summer season, 29 (5.81%) resorts are available with a summer ski option, and 295 (59.12%) resorts are present where you can plan for night skiing.
Breckenridge is the resort located at the highest point (3914 m) in the United States, with an average daily price of € 140. In Canada, the "Le Massif" resort is located at the lowest point of 36 meters and costs € 51.

Looking for the longest ski run?
The resorts with the longest 16-kilometer runs are Alpe d'Huez (France), Bansko (Bulgaria), and Les Deux Alpes (France). If you are looking for the ski resort with the most difficult slopes, Big Sky Resort (USA) has 126 difficult slopes. Les Sybelles-Le Corier (France) has the most intermediate slopes (239), while Les 3 Vallees (France) has the most beginner slopes (312).


If you're looking for resorts with free entry, consider the following options:
Yellowstone Club(United States)
Alpika Service(Russia)
High1 Resort(South Korea)
Palandoken-Ejder 3200 World Ski Center(Turkey)
Perisher(Australia)
Pragelato(Italy)
Puigmal(France)
Sun Mountain-Yabuli(China)
Uludag-Bursa(Turkey)

If you are planning to visit a ski resort, the best time would be from December to April because the most snow falls during this season.


Some key insights from the above analysis include:
  • Out of the 499 resorts, 99% are child-friendly, 40.88% offer night skiing, and 5.81% offer summer skiing.
  • Europe has 72% of the world's ski resorts, with North America coming in second with 19.64%.South America is at the bottom with seven (1.40%) resorts.
  • Oceania, with 58% of beginners' slope, is suitable for people who are looking for beginners' slope. North and South America are the continents with the most difficult slopes. whereas Europe is suitable for intermediate slopes.
  • Resorts in North America, with an average price of €77, are more expensive as compared to other continents and Asia, with the lowest average price of €33.
  • The best time to plan a visit to a ski resort is between December and April, when the most snow falls.
  • If this is your first trip, Europe is an excellent choice because the majority of the ski resorts are located there, are reasonably priced, and are suitable for intermediate skiers.


Technology Topper Sunday, February 19, 2023
Read more ...
120 years of Olympic history | SQL Project | MySQL Workbench
SQL Workbench

In this SQL project, I worked on a 120-year Olympic history dataset, where I tried to find some insight by writing SQL queries. I used MySQL Workbench to analyze the dataset for this project. I have analyzed the dataset in the form of questions and answers by writing SQL queries where i used joins, common table expression, subqueries, window function, etc.

This dataset contains 2 tables, in CSV format:
  • The Athlete Events table contains over 270,000 Olympic performances across history
  • Each record represents an individual athlete competing in an individual event
  • Records contain details about the athlete (ID, sex, name, age, height, weight, country) and the event (games, year, city, sport, event, medal)
  • The NOC Region table serves as a lookup table with “NOC” as the primary key
  • Each record represents one country according to the National Olympic Committee.

Loading dataset to MySQL Workbench Database:

athlete_events table:


noc_regions table:


SQL Queries:
I am writing SQL Queries using this data. For each of these queries, you would find the problem statement, SQL Queries and then the screen shot of the output(some screen shot contains few lines of output).


1. How many olympics games have been held?
Problem Statement: Write a SQL query to find the total no of Olympic Games held as per the dataset.

select count(distinct(Games)) as olympics_games
from athlete_events;

Output:


2. List down all Olympics games held so far.
Problem Statement: Write a SQL query to list down all the Olympic Games held so far.

select distinct year, season, city
from athlete_events
order by year;

Output:


3. Mention the total no of nations who participated in each olympics game?
Problem Statement: SQL query to fetch total no of countries participated in each olympic games.

with all_countries as
    (select games, nr.region
    from athlete_events oh
    join noc_regions nr ON nr.noc = oh.noc
    group by games, nr.region)
select games, count(1) as total_countries
from all_countries
group by games
order by games;

Output:


4. Which year saw the highest and lowest no of countries participating in Olympics
Problem Statement: Write a SQL query to return the Olympic Games which had the highest participating countries and the lowest participating countries.

with all_countries as
    (select games, nr.region
    from athlete_events oh
    join noc_regions nr ON nr.noc=oh.noc
    group by games, nr.region),
tot_countries as
    (select games, count(1) as total_countries
    from all_countries
    group by games)
select distinct
concat(first_value(games) over(order by total_countries)
, ' - '
, first_value(total_countries) over(order by total_countries)) as Lowest_Countries,
concat(first_value(games) over(order by total_countries desc)
, ' - '
, first_value(total_countries) over(order by total_countries desc)) as Highest_Countries
from tot_countries
order by 1;

Output:


5. Which nation has participated in all of the olympic games?
Problem Statement: SQL query to return the list of countries who have been part of every Olympics games.

with tot_games as
    (select count(distinct games) as total_games
    from athlete_events),
countries as
    (select games, nr.region as country
    from athlete_events oh
    join noc_regions nr ON nr.noc=oh.noc
    group by games, nr.region),
countries_participated as
    (select country, count(1) as total_participated_games
    from countries
    group by country)
select cp.*
from countries_participated cp
join tot_games tg on tg.total_games = cp.total_participated_games
order by 1;

Output:


6. Identify the sport which was played in all summer olympics.
Problem Statement: SQL query to fetch the list of all sports which have been part of every olympics.

with tot_games as
    (select count(distinct(games)) as total_games
    from athlete_events where season = 'Summer'),
sports_played as
    (select games, sport
    from athlete_events
    group by games, sport),
game_participated as
    (select sport, count(1) as total_participated_games
    from sports_played
    group by sport)
select cp.*
from game_participated cp
join tot_games tg on tg.total_games = cp.total_participated_games
order by 1;

Output:


7. Which Sports were just played only once in the olympics.
Problem Statement: Using SQL query, Identify the sport which were just played once in all of olympics.

with t1 as
    (select distinct games, sport
    from athlete_events),
t2 as
    (select sport, count(1) as no_of_games
    from t1
    group by sport)
select t2.*, t1.games
from t2
join t1 on t1.sport = t2.sport
where t2.no_of_games = 1
order by t1.sport;

Output:


8. Fetch the total no of sports played in each olympic games.
Problem Statement: Write SQL query to fetch the total no of sports played in each olympics.

select Games, count(distinct(Sport)) as total_sports
from athlete_events
group by Games
order by total_sports desc, Games;

Output:


9. Fetch oldest athletes to win a gold medal
Problem Statement: SQL Query to fetch the details of the oldest athletes to win a gold medal at the olympics.

select * from athlete_events
where Medal = 'Gold' and
Age = (select max(Age) from athlete_events where Medal = 'Gold');

Output:


10. Fetch the top 5 athletes who have won the most gold medals.
Problem Statement: SQL query to fetch the top 5 athletes who have won the most gold medals.

with m1 as(
    select Name, Team, count(Medal) as tot
    from athlete_events
    where Medal ='Gold'
    group by Name, Team
    order by tot desc),
m2 as
    (select Name, Team, tot, dense_rank() over(order by tot desc) as rnk
    from m1)
select name, team, tot
from m2
where rnk <= 5;

Output:


11. Fetch the top 5 athletes who have won the most medals (gold/silver/bronze).
Problem Statement: SQL Query to fetch the top 5 athletes who have won the most medals (Medals include gold, silver and bronze).

with m1 as(
    select Name, Team, count(Medal) as tot
    from athlete_events
    where Medal <> 'NA'
    group by Name, Team
    order by tot desc, Team, Name),
m2 as
    (select Name, Team, tot, dense_rank() over(order by tot desc) as rnk
    from m1)
select name, team, tot
from m2
where rnk <= 5;

Output:


12. Fetch the top 5 most successful countries in olympics. Success is defined by no of medals won.
Problem Statement: Write a SQL query to fetch the top 5 most successful countries in olympics. (Success is defined by no of medals won).

with cte as(
    select r.Region, count(a.Medal) as Total_Medal
    from athlete_events a join noc_regions r
    on a.noc = r.noc
    where a.Medal <> 'NA'
    group by r.Region
    order by Total_Medal desc)
select Region, Total_Medal, row_number() over(order by Total_Medal desc) as rnk
from cte limit 5;

Output:


reference :
https://techtfq.com/blog/practice-writing-sql-queries-using-real-dataset
https://www.mavenanalytics.io/blog/maven-olympics-challenge


Technology Topper Sunday, January 08, 2023
Read more ...
Movie Ratings Analysis | Python Project | Pandas, Seaborn, Matplotlib

In this Python Data Analysis Project, I worked on a dataset that contains the different genres of movies, ratings received by the expert and audience, year of release, and budget in millions. While working on this project, I used the Pandas, Seaborn, and Matplotlib python libraries. By using these libraries, I built different types of graphs and charts, which helps us make the analysis easier. In this project, I have analyzed which movie genres are popular among the audience based on their ratings. We can suggest which genre would be best if the producer or director wanted to make a movie at the end of this project.

Python Code
        Most of the movies belong to the action, comedy, and drama genres, which shows that audiences are more interested in this type of movie. Movies with very high audience and critic ratings are considered to be highly liked. That happens mostly for action, drama, and thrillers. By analyzing this dataset, domain experts can make their decisions for upcoming movies that are popular among the audience as per their ratings. So, if a producer or director wants to make a film, the above-mentioned genre will be most preferred in order to get the best response from the audience and earn the most profit from that film.
Movie Ratings Analysis | Python Project


Technology Topper Wednesday, December 28, 2022
Read more ...

SET Operators in SQL | UNION, UNION ALL, INTERSECT, MINUS

Set operators are specialized types of operators that are used to combine the results of two or more queries. These operators are used to extract the desired results from the table data that is stored in the table. The set operators and SQL joins have a similar look, but they differ significantly. SQL joins combine the columns from different tables, whereas SQL operators combine rows from different queries. Though both concepts are used to combine data from multiple tables, joins combine columns from separate tables, whereas set operations combine rows from separate tables.

When using set operators in SQL, you must follow certain rules. The following are some of these:
  • The number of columns in the both the SELECT statement must be the same.
  • The order of columns must be in the same order.
  • The selected columns must have the same data type.

Types of Set Operations 
There are different types of set operators that are mentioned below:
  • UNION
  • UNION ALL
  • INTERSECT
  • MINUS
SET Operators in SQL


To understand the above set operators lets consider a two tables. We will perform all set operation on above mentioned table.
table1table2
AA
BB
CE
DF

1. UNION 
  • UNION combines & return the distinct result of two or more SELECT statements.
  • Output sorted by default
  • Not desired from performance aspect since this involves duplicate removal & sorting.
Syntax:
SELECT * FROM table1
UNION
SELECT * FROM table2;

Output:
output
A
B
C
D
E
F


2. UNIONALL 
  • UNIONALL return all the rows from two or more SELECT statements.
  • Output not sorted by default
  • Wont remove duplicate values
  • Desired from performance aspect since no duplicate removal & sorting are performed.
Syntax:
SELECT * FROM table1
UNIONALL
SELECT * FROM table2;

Output:
output
A
B
C
D
A
B
E
F


3. INTERSECT 
  • INTERSECT return all the common rows from two or more SELECT statements.
  • Output is sorted by default.
  • Remove the duplicate records.
Syntax:
SELECT * FROM table1
INTERSECT
SELECT * FROM table2;

Output:
output
A
B


4. MINUS 
  • MINUS return all the record from one table excluding records from other table.
  • Output is sorted by default.
  • Remove the duplicate records.
Syntax:
SELECT * FROM table1
MINUS
SELECT * FROM table2;

SELECT * FROM table2
MINUS
SELECT * FROM table1;

Output:
output
C
D

output
E
F


Technology Topper Monday, December 26, 2022
Read more ...

SQL Operators

An operator is a reserved word or a character used primarily in an SQL statement WHERE clause to perform operation(s), such as comparisons and arithmetic operations. These Operators are used to specify conditions in an SQL statement and to serve as conjunctions for multiple conditions in a statement.

SQL operators are used for filtering the table's data by a specific condition in the SQL statement.

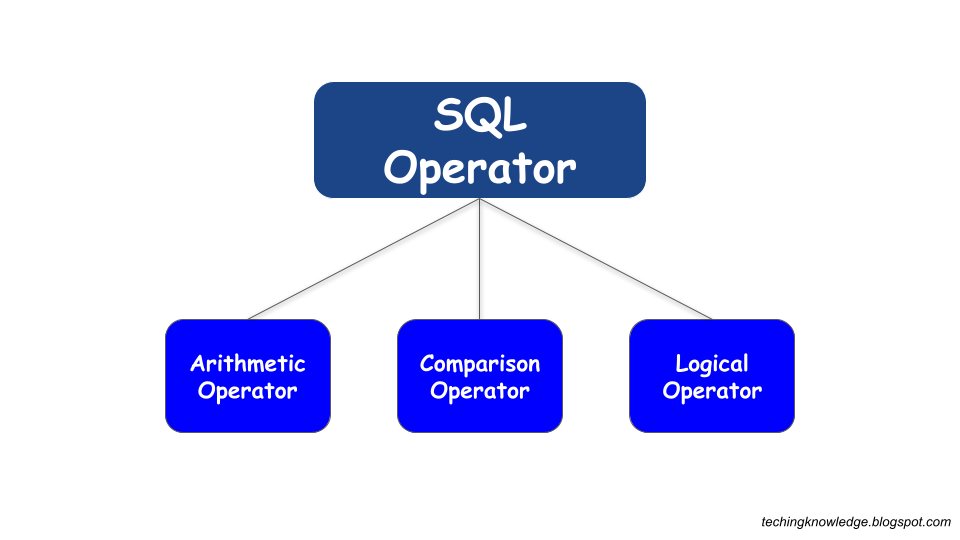
Types of Operator
SQL operators are categorized in the following categories:
  • SQL Arithmetic Operators
  • SQL Comparison Operators
  • SQL Logical Operators
SQL Operators


Precedence of SQL Operator
The precedence of SQL operators is the sequence in which the SQL evaluates the different operators in the same expression. Structured Query Language evaluates those operators first, which have high precedence.

SQL Operator Symbols

Operators

**

Exponentiation operator

=+, -

Identity operator, Negation operator

*, /

Multiplication operator, Division operator

=+, -, ||

Addition (plus) operator, subtraction (minus) operator, String Concatenation operator

=, !=, <, >, <=, >=, IS NULL, LIKE, BETWEEN, IN

Comparison Operators

NOT

Logical negation operator

&& or AND

Conjunction operator

OR

Inclusion operator


1. Arithmetic Operators
Arithmetic operators are used to perform arithmetic operations such as addition, subtraction, division, and multiplication. These operators usually accept numeric operands.

Operator

Operation

Description

+

Addition

Adds operands on either side of the operator

-

Subtraction

Subtracts the right-hand operand from the left-hand operand

*

Multiplication

Multiplies the values on each side

/

Division

Divides left-hand operand by right-hand operand

%

Modulus

Divides left-hand operand by right-hand operand and returns the remainder


2. Comparison Operators
The comparison operators in SQL compare two different sets of data from SQL tables and check whether they are the same, greater, or lesser. It checks whether one expression is identical to another. Comparison operators are generally used in the WHERE clause of a SQL query. The result of a comparison operation may be true, false, or unknown. When one or both of the expressions are NULL, then the operator returns UNKNOWN. These operators could be used on all types of expressions except those that contain text, ntext or images.

Operator

Operation

Description

=

Equal to

Checks if both operands have equal value, if yes, then returns TRUE

>

Greater than

Checks if the value of the left-hand operand is greater than the right-hand operand or not

<

Less than

Returns TRUE if the value of the left-hand operand is less than the value of the right-hand operand

>=

Greater than or equal to

It checks if the value of the left-hand operand is greater than or equal to the value of the right-hand operand, if yes, then returns TRUE

<=

Less than or equal to

Examines if the value of the left-hand operator is less than or equal to the right-hand operand

<> or !=

Not equal to

Checks if values on either side of the operator are equal or not. Returns TRUE if values are not equal

!>

Not greater than

Used to check if the left-hand operator’s value is not greater than or equal to the right-hand operator’s value

!<

Not less than

Used to check if the left-hand operator’s value is not less than or equal to the right-hand operator’s value


3. Logical Operators
The logical operators in SQL perform the Boolean operations, which give two results: true and false. Logical operators take two expressions as operands and return TRUE or FALSE as output. While working with complex SQL statements and queries, comparison operators come in handy, and these operators work in the same way as logic gates do.

Operator

Operation

Description

=

Equal to

Checks if both operands have equal value, if yes, then returns TRUE

>

Greater than

Checks if the value of the left-hand operand is greater than the right-hand operand or not

<

Less than

Returns TRUE if the value of the left-hand operand is less than the value of the right-hand operand

>=

Greater than or equal to

It checks if the value of the left-hand operand is greater than or equal to the value of the right-hand operand, if yes, then returns TRUE

<=

Less than or equal to

Examines if the value of the left-hand operator is less than or equal to the right-hand operand

<> or !=

Not equal to

Checks if values on either side of the operator are equal or not. Returns TRUE if values are not equal

!>

Not greater than

Used to check if the left-hand operator’s value is not greater than or equal to the right-hand operator’s value

!<

Not less than

Used to check if the left-hand operator’s value is not less than or equal to the right-hand operator’s value


Technology Topper Saturday, December 10, 2022
Read more ...